


SPARKvue screenshots (9)

Description SPARKvue
Struggling to Connect Real-World Data to STEM Learning Concepts?
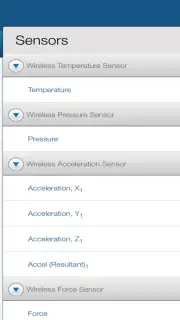
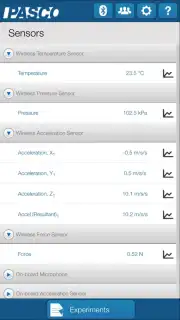
SPARKvue provides a direct bridge between theoretical science education and practical, hands-on experimentation. This comprehensive data collection, visualization, and analysis platform is engineered specifically for STEM environments, serving as a critical tool for both instructors and students to move beyond textbook diagrams. The core functionality enables real-time data capture from a vast array of sensors—including those for pH, temperature, force, and carbon dioxide levels—directly onto mobile devices or computers, transforming any space into a functional lab.
Core Platform Functionality and Integration
The application is built for cross-platform deployment, maintaining full operability on Android, Chromebooks, iPads, and Mac and Windows operating systems. Its architecture is designed for seamless integration with PASCO's ecosystem, particularly through Bluetooth Smart wireless sensors, which allows for rapid device pairing and immediate commencement of data logging. Support extends to over 80 distinct PASCO sensors, enabling experimental setups for physics, chemistry, biology, and environmental science without proprietary hardware barriers.
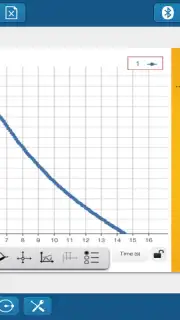
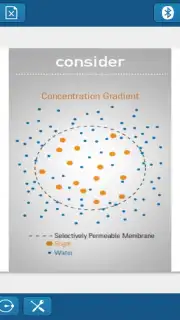
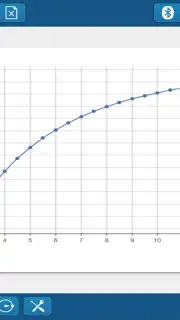
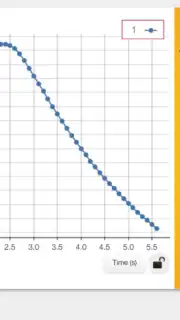
Data representation is handled through multiple, simultaneous view modes. Users can configure their workspace with graphs, bar charts, meters, and digital displays, arranging them alongside embedded images, instructional videos, and text notes to create custom lab interfaces. While phone screens present some layout limitations, tablet and desktop experiences offer full customization. For analysis, the suite includes built-in statistical tools, curve-fitting parameters, and graph zoom/scale functions for detailed examination of data sets. Further context can be added through image annotation tools and direct multimedia embedding into active experiments.
- Captures live data from over 80 wireless sensors for pH, force, gas, and temperature.
- Displays data in configurable graphs, charts, meters, and digital readouts simultaneously.
- Provides statistical calculations, curve fitting, and zoom tools for in-app analysis.
- Creates electronic lab journals with embedded images, videos, and text annotations.
- Shares live data feeds across devices for collaborative class or remote group work.
Workflow management is facilitated through features for creating full electronic lab journals and integration with cloud services for file sharing and submission. A key collaborative feature allows a live data stream to be shared from a primary device to multiple student devices, enabling synchronized, interactive classroom sessions where each participant can collect, manipulate, and analyze the shared dataset independently. The platform includes a library of pre-loaded curriculum activities and provides the tools for educators to build, save, and distribute their own custom labs.
The interface is standardized across all supported devices and operating systems, reducing the learning curve and keeping the educational focus on the experiment rather than the software. It is designed for use in diverse technological settings, from interactive whiteboards to individual student tablets and phones. The application includes support resources and is localized into 28 languages for global accessibility.
We suggest trying SPARKvue to transform abstract STEM principles into tangible, interactive discovery.
Download the SPARKvue mobile app now.
Internet required. IAP available.
Information
| Version | 4.12.4.4 |
| Developer | PASCO scientific |
| Requirements | Android Android + 11+ |
| Updated | 17.03.2026 |
| Size | 181.62 MB |
| Package | com.isbx.pasco.Spark |
| Signature | 896f434543ae482dfe48394dd5e211c9 |
| Architecture | armeabi-v7a, x86, arm64-v8a, x86_64 |


